


|
|
|
|
The E-pH diagram of aluminum is one of the simplest E-pH diagrams. It will be used here to demonstrate how such diagrams are constructed from basic principles. In the following discussion, only four species containing the aluminum element will be considered: (reference)
two solid species (Al and Al2O3.H2O)
two ionic species (Al3+ and AlO2-)
The first equilibrium to consider examines the possible presence of either Al3+ or AlO2- expressed in equation.
![]()
Since there is no change in valence of the aluminum present in the two ionic species considered, the associated equilibrium is independent of the potential and the expression of that equilibrium can be derived in the following expression for standard conditions.
![]()
where Q is expressed in equation.
Assuming that the activity of H2O is unity and that the activities of the two ionic species are equal, one can obtain a simpler expression of the equilibrium in equation based purely on the activity of H+, equation and its logarithmic form, equation.
![]()
and if G0 is expressed in Joules and the temperature is 25oC or 298 K equation is even further simplified.
![]()
By using the standard thermodynamic data from the literature, it is possible to calculate that the free energy of reaction is in fact equal to 120.44 kJ mol-1 when both [Al3+] and [AlO2-] are equal. Equation then becomes equation.
![]()
This is represented, in the E-pH diagram shown below, by a dotted vertical line separating the dominant presence of Al3+ at low pH from the dominant presence of AlO2- at the higher end of the pH scale.
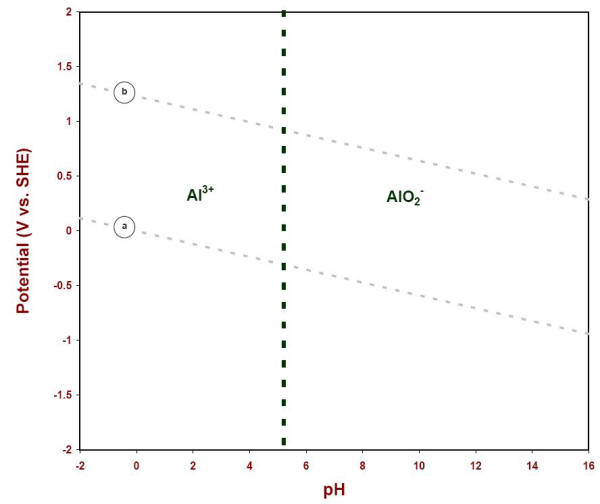
E-pH diagram showing the soluble species of aluminum in water at 25oC
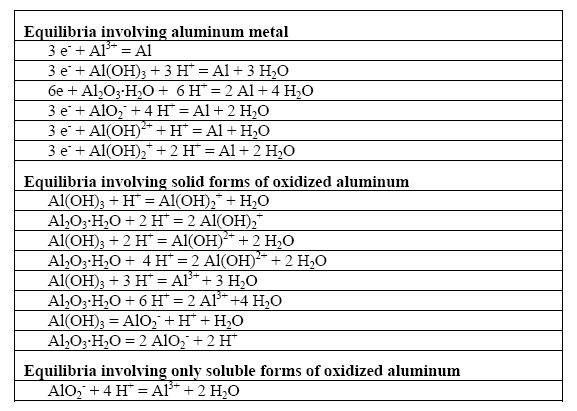
The next phase for constructing the aluminum E-pH diagram is to consider all possible reactions between the four chemical species containing aluminum retained for this exercise, i.e. Al, Al2O3.H2O, Al3+, and AlO2-. These reactions are summarized in the following Table.
Possible reactions in the Al-H2O system
A computer program would compare all possible interactions and rank the chemical species involved in terms of their thermodynamic stability for all conditions of pH and potential would typically carry out this work. The following Figure illustrates the results of such computation for aluminum in the presence of water at 25oC when the activities of all species considered were set at value unity.
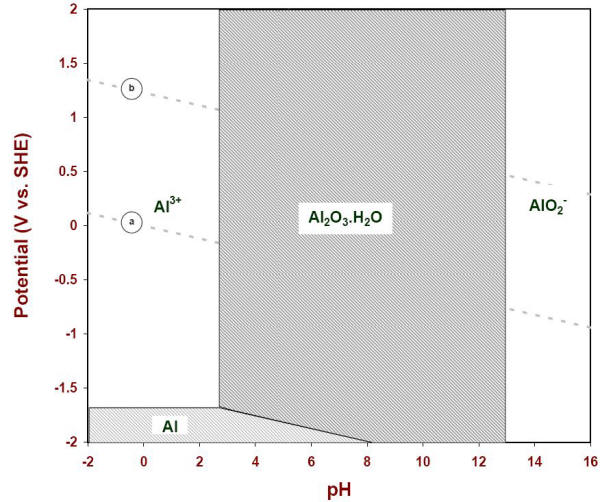
E-pH diagram of solid species of aluminum when the soluble species are at one molar concentration (25oC)
However, an additional consideration is necessary to make such diagrams useful for corrosion situations for which the presence of soluble species in the environment never reaches values of the order of one molar. The following Figure illustrates the results that were computed by setting the concentrations of soluble species at decreasing values of one (100), one hundredth (10-2), one in ten thousand (10-4), and one in a million (10-6). The apparent stability of the solid species considered gradually recedes as lower values of soluble species are used in the calculations.
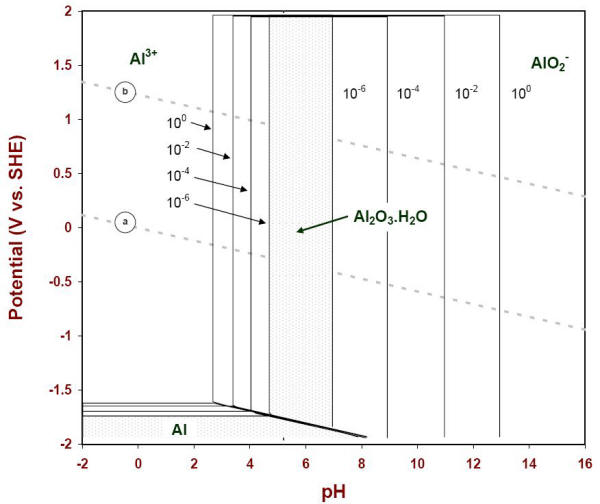
E-pH diagram of aluminum with four concentrations of soluble species (25oC)
It is customary to use the lowest boundary (10-6) as a practical indication of the corrosion stability of a metal and its solid products (Figure 4.12).
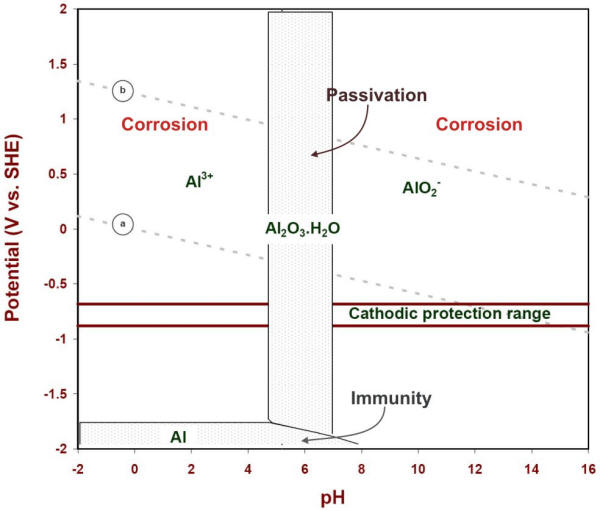
E-pH corrosion diagram of aluminum at 25oC
The usefulness of this graphical representation of thermodynamic data for corrosion studies was discussed by Pourbaix who showed three possible states of a metallic material:
Immunity region: In the conditions of potential and pH of that region a metal is considered to be totally immune from corrosion attack and safe to use. Cathodic protection may be used to bring the potential of a metal closer to that region by forcing a cathodic shift, as shown for aluminum by the domain specified in the previous Figure (-1.0 to 1.2 V vs. CCSRE)
Passive region: In such region a metal tends to become coated with an oxide or hydroxide that may form on the metal either as a compact and adherent film practically preventing all direct contact between the metal itself and the environment, or as a porous deposit which only partially prevents contact between the metal and the environment;
Corrosion region: Thermodynamic calculations indicate that, in such region of an E-pH diagram, a metal is stable as an ionic (soluble) product and therefore susceptible to corrosion attack. Experience is required to find out the extent and form of the corrosion attack that may occur in the corrosion region(s) of a Pourbaix diagram.
| (previous) | Page 14 of 17 | (next) |
See also: Equilibrium reactions of iron in water, Iron corrosion products, Iron species and their thermodynamic data, Rust chemistry, Rust converters, Steel corrosion